Generate HTML Report
The plot function will create a HTML report with plots of the contents of a Stock object. For example, running the plot function on the example Albacore Stock object:
plot(Albacore)will create this HTML report. See the help documentation or type ?plot.Stock in the R console for more information on plotting Stock objects.
Plot Stock Components
Individual plots of the components in the Stock object can be generated using the plot function and specifying the name of the component to plot in the first argument and a stock object as the second argument.
The options for plotting the components are shown by clicking the buttons below.
plot('Depletion', Albacore) 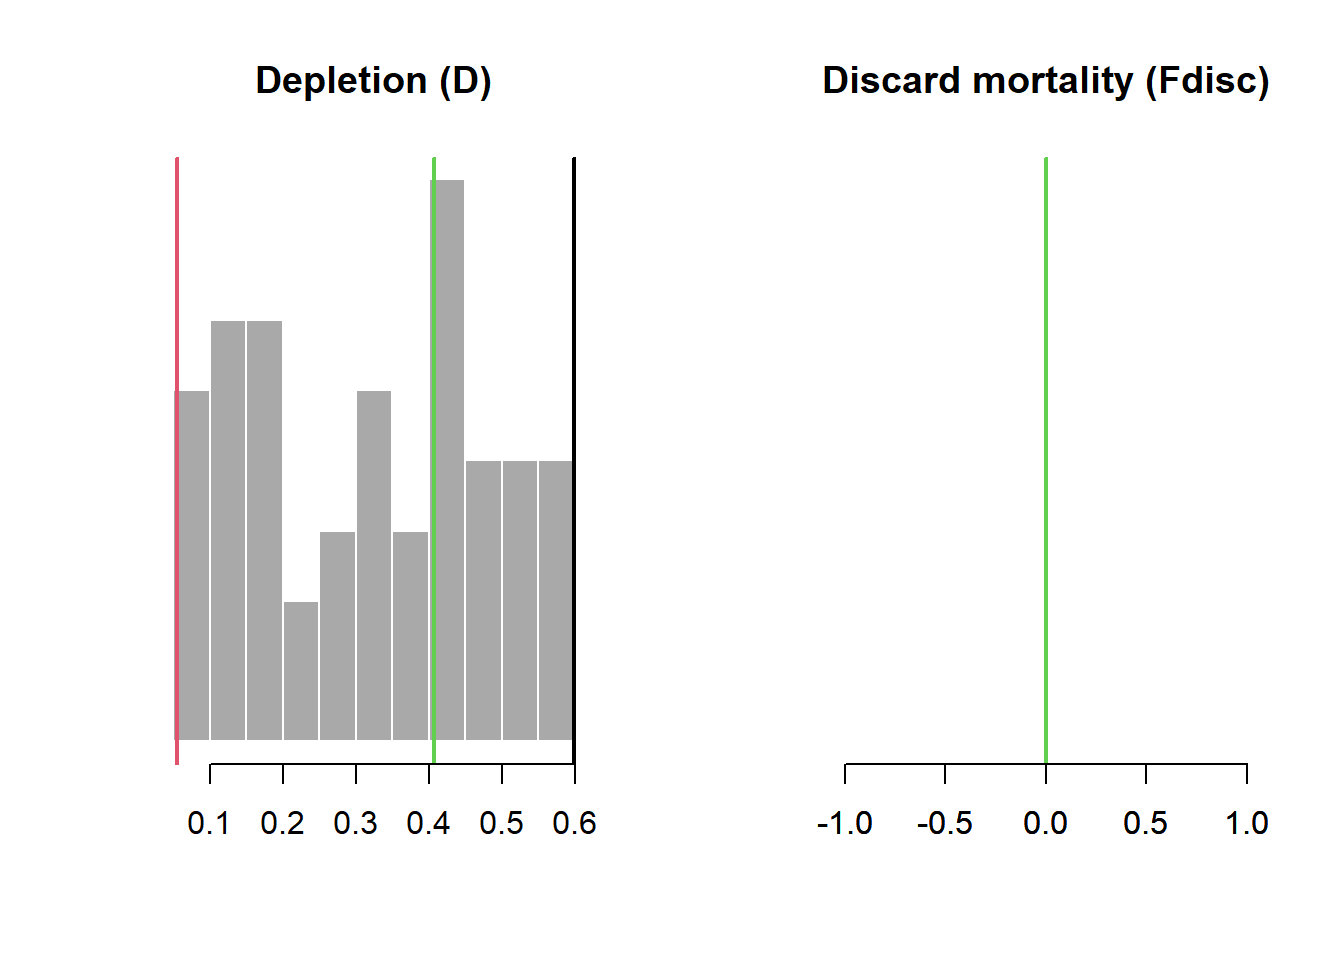
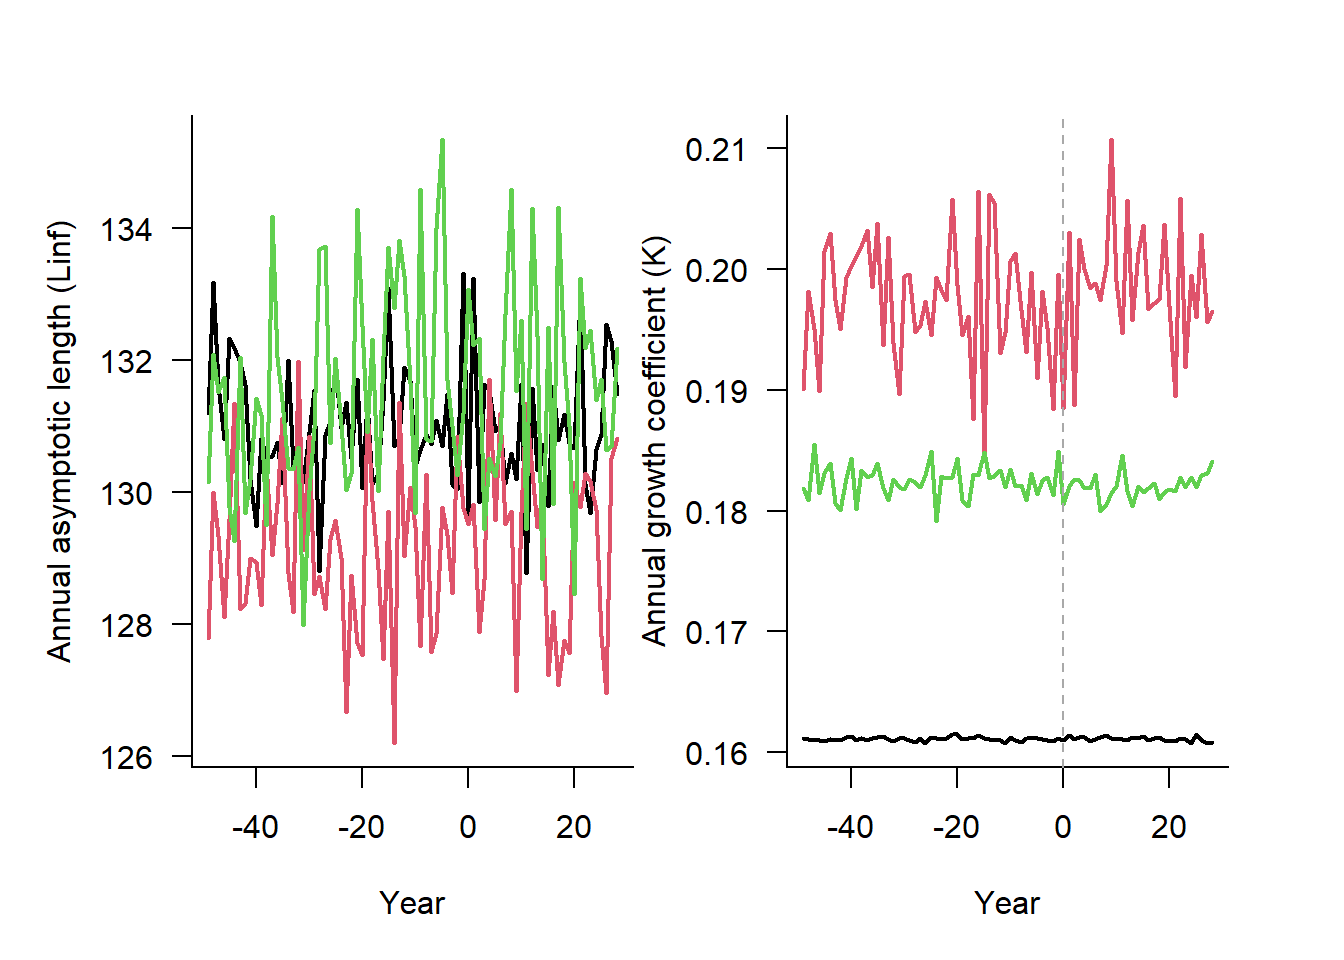
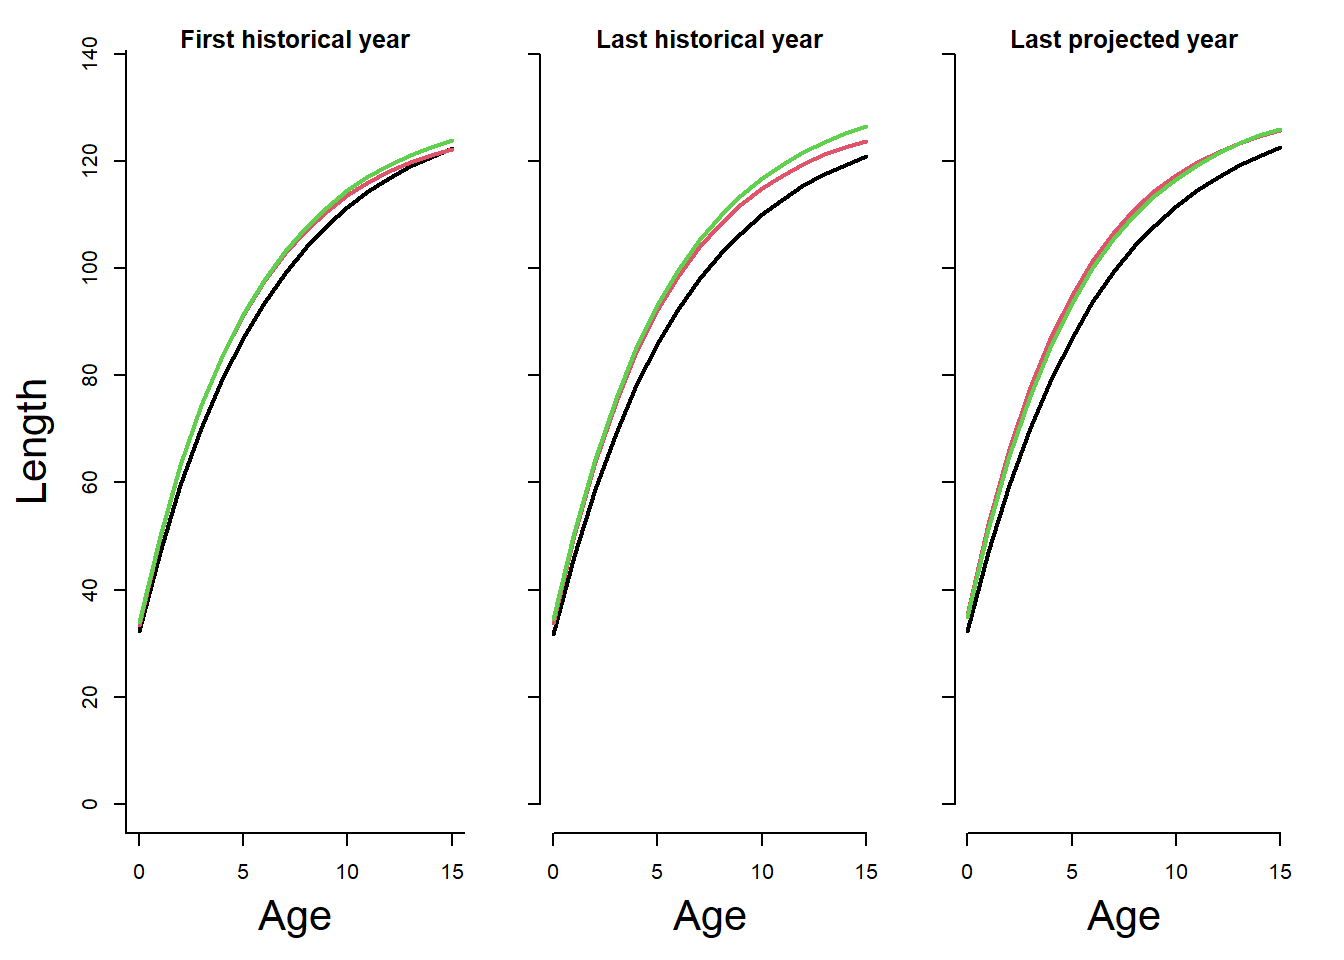
plot('Growth', Albacore)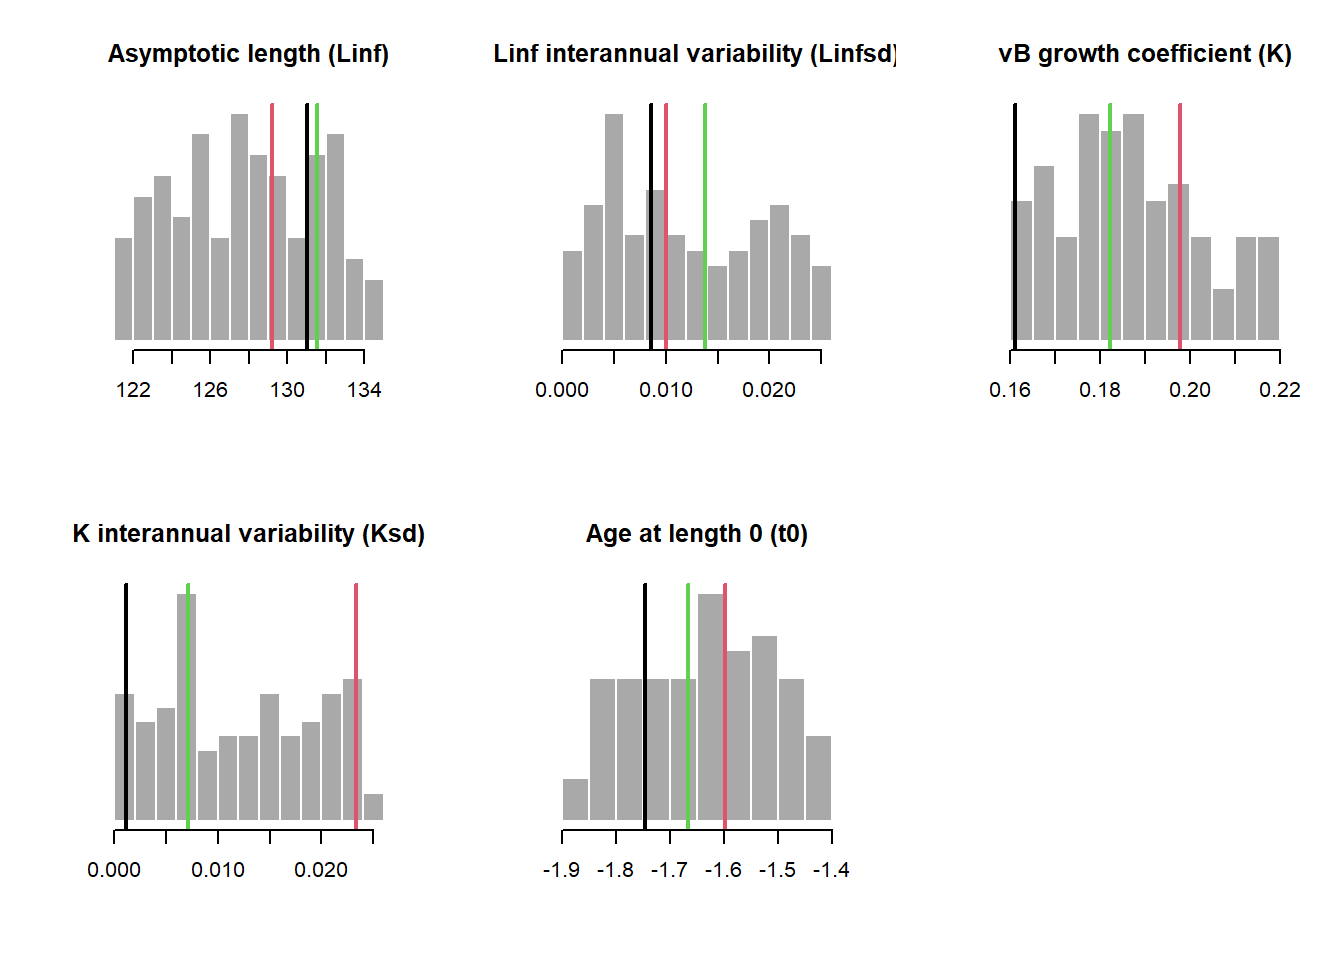
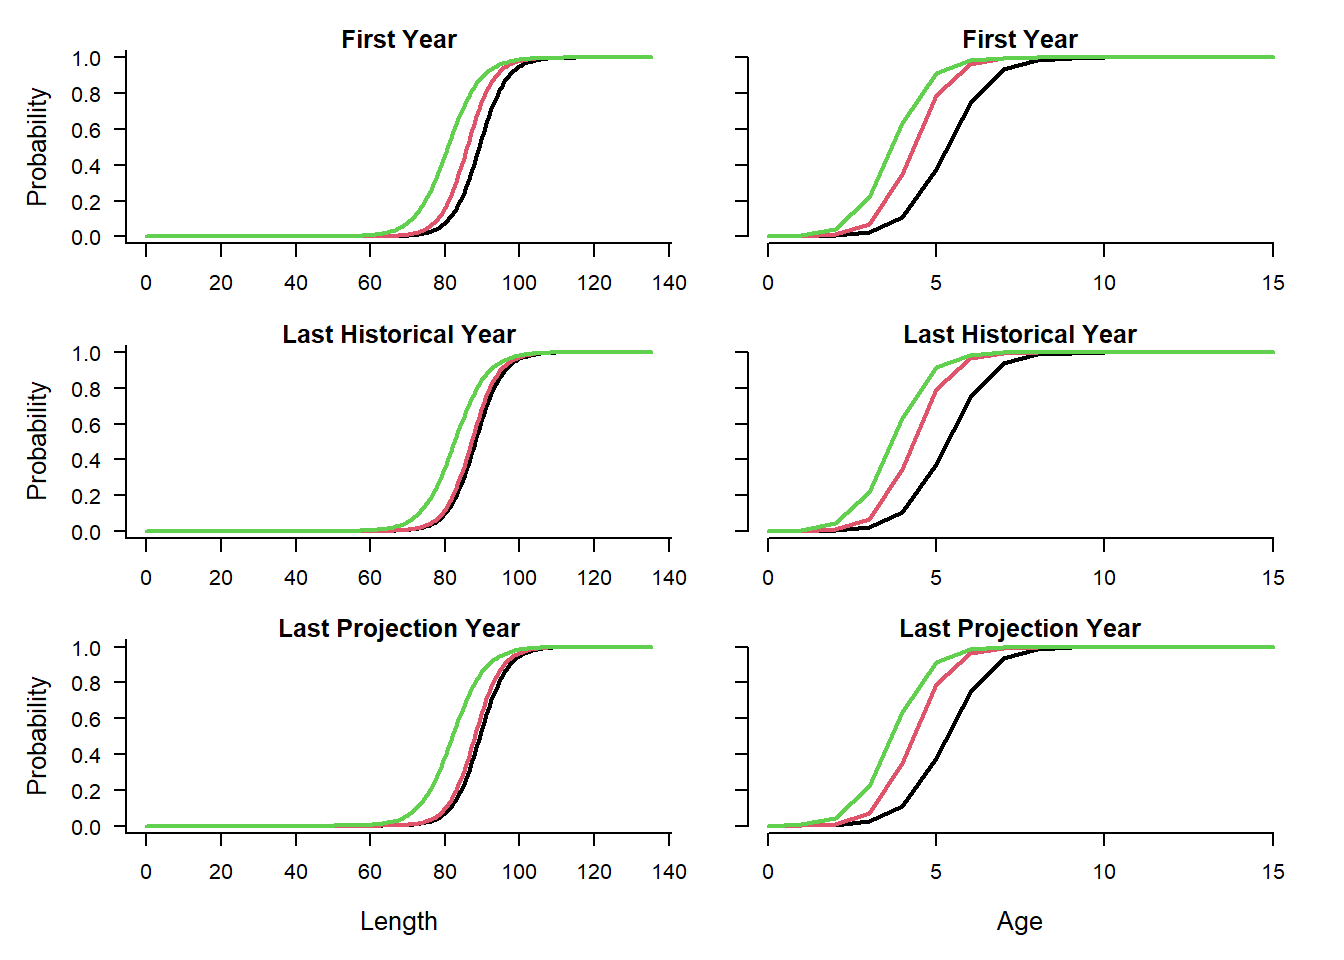
plot('Maturity', Albacore)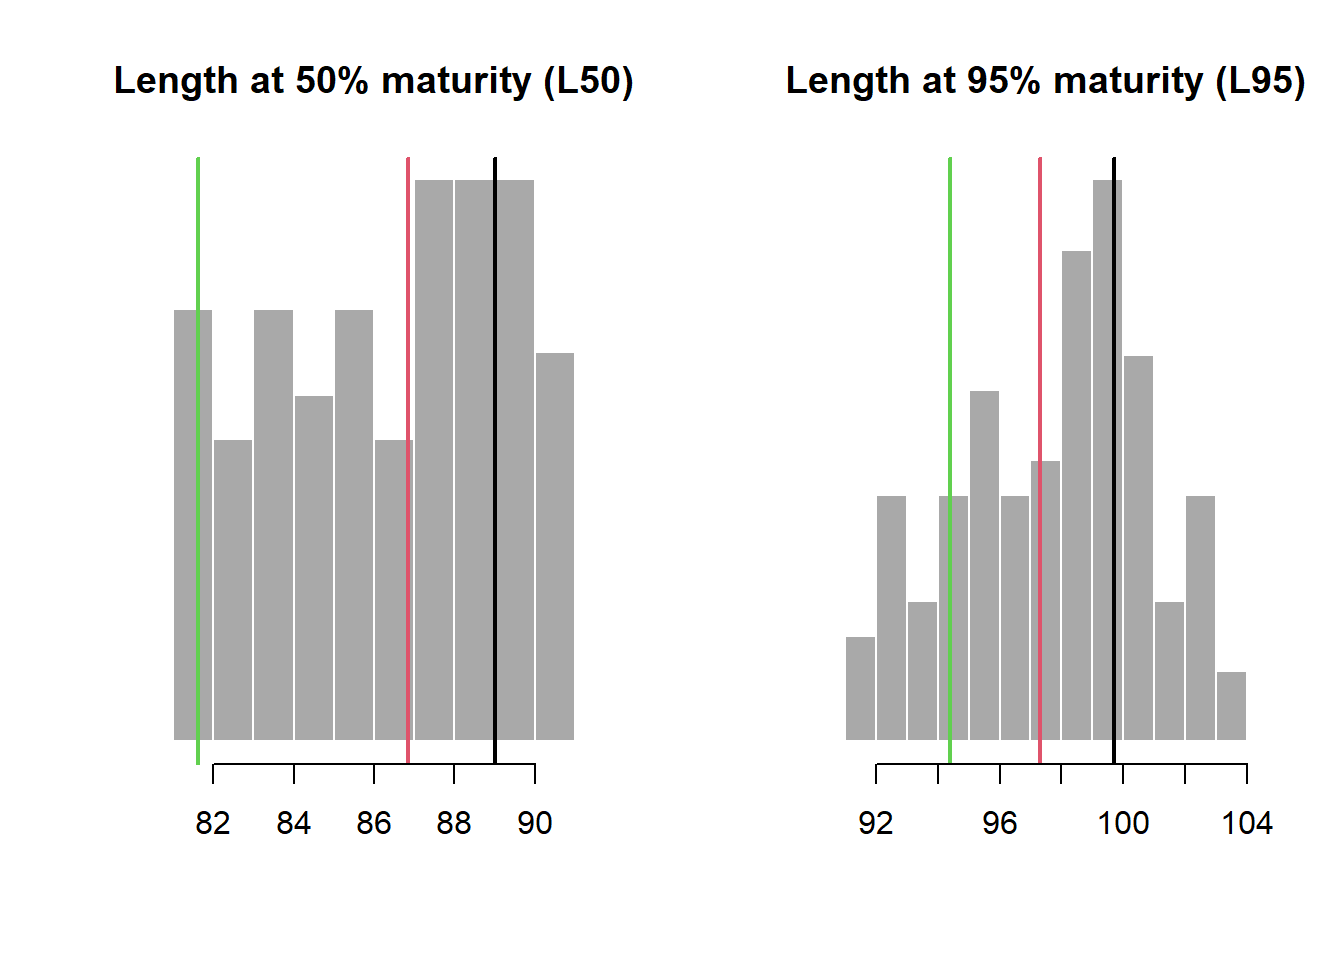
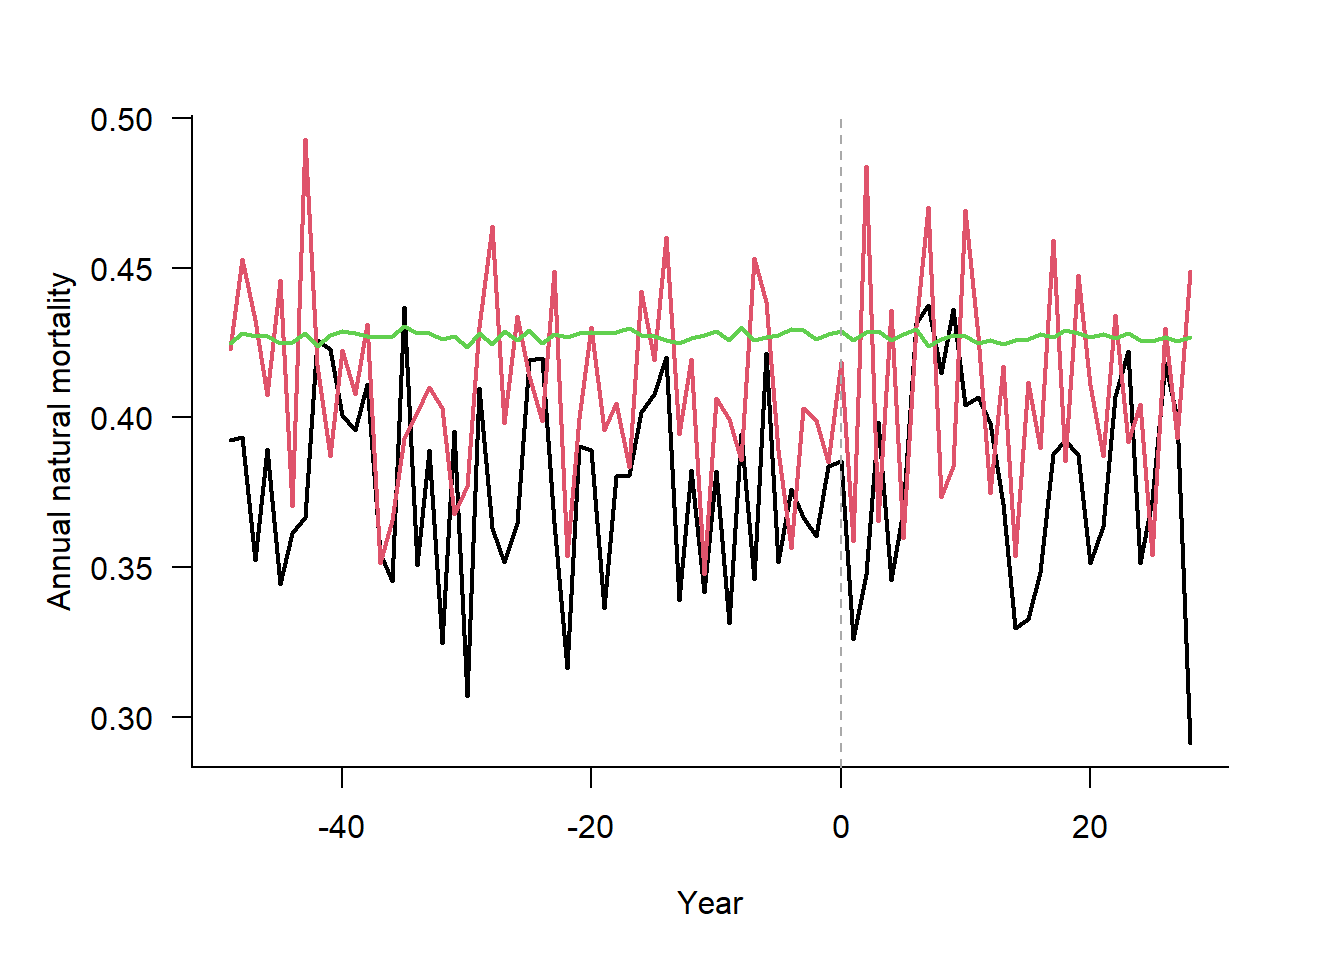
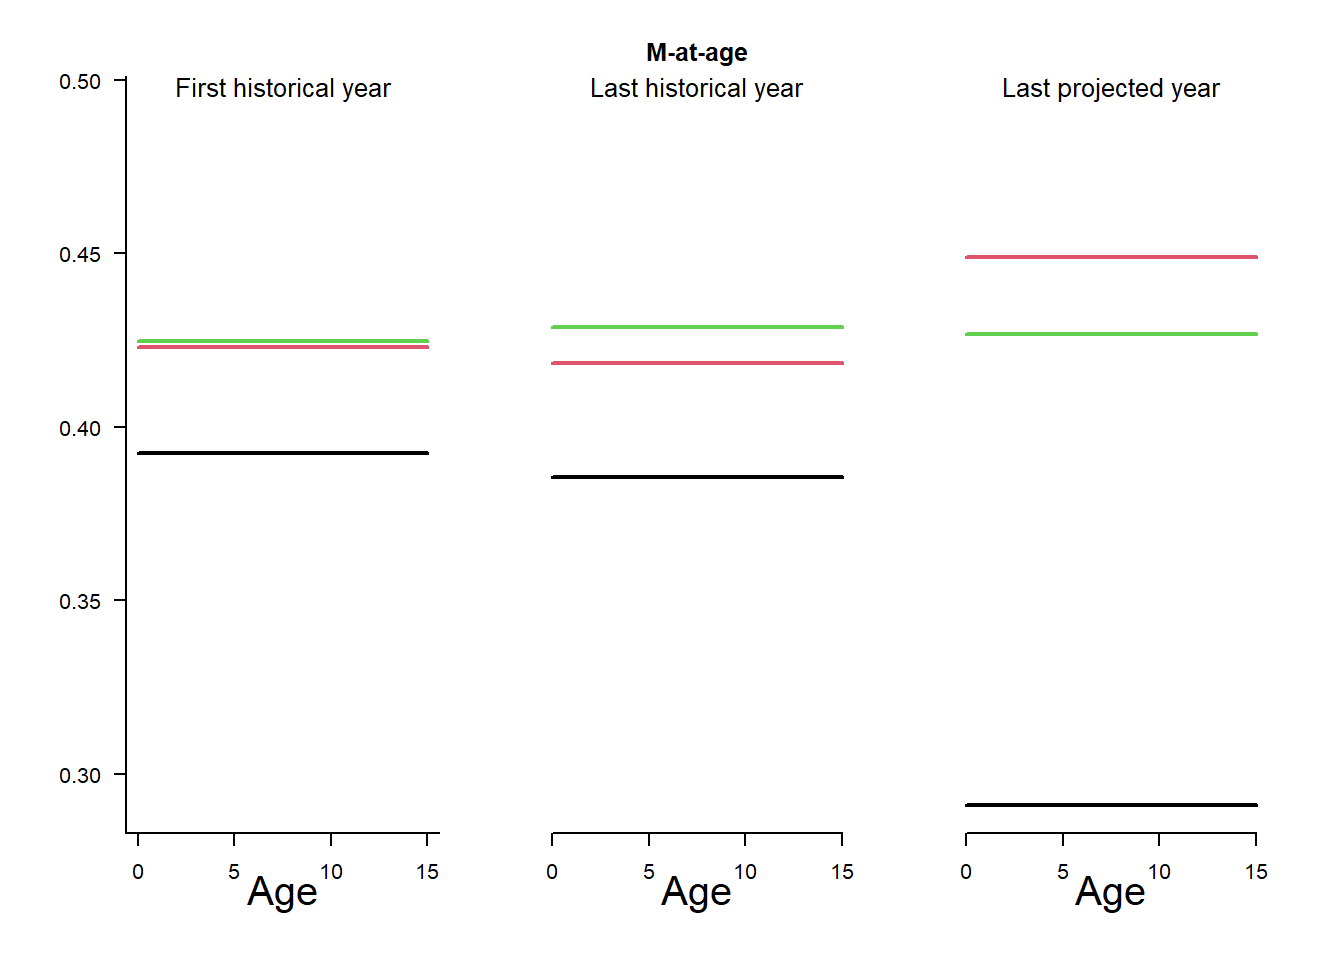
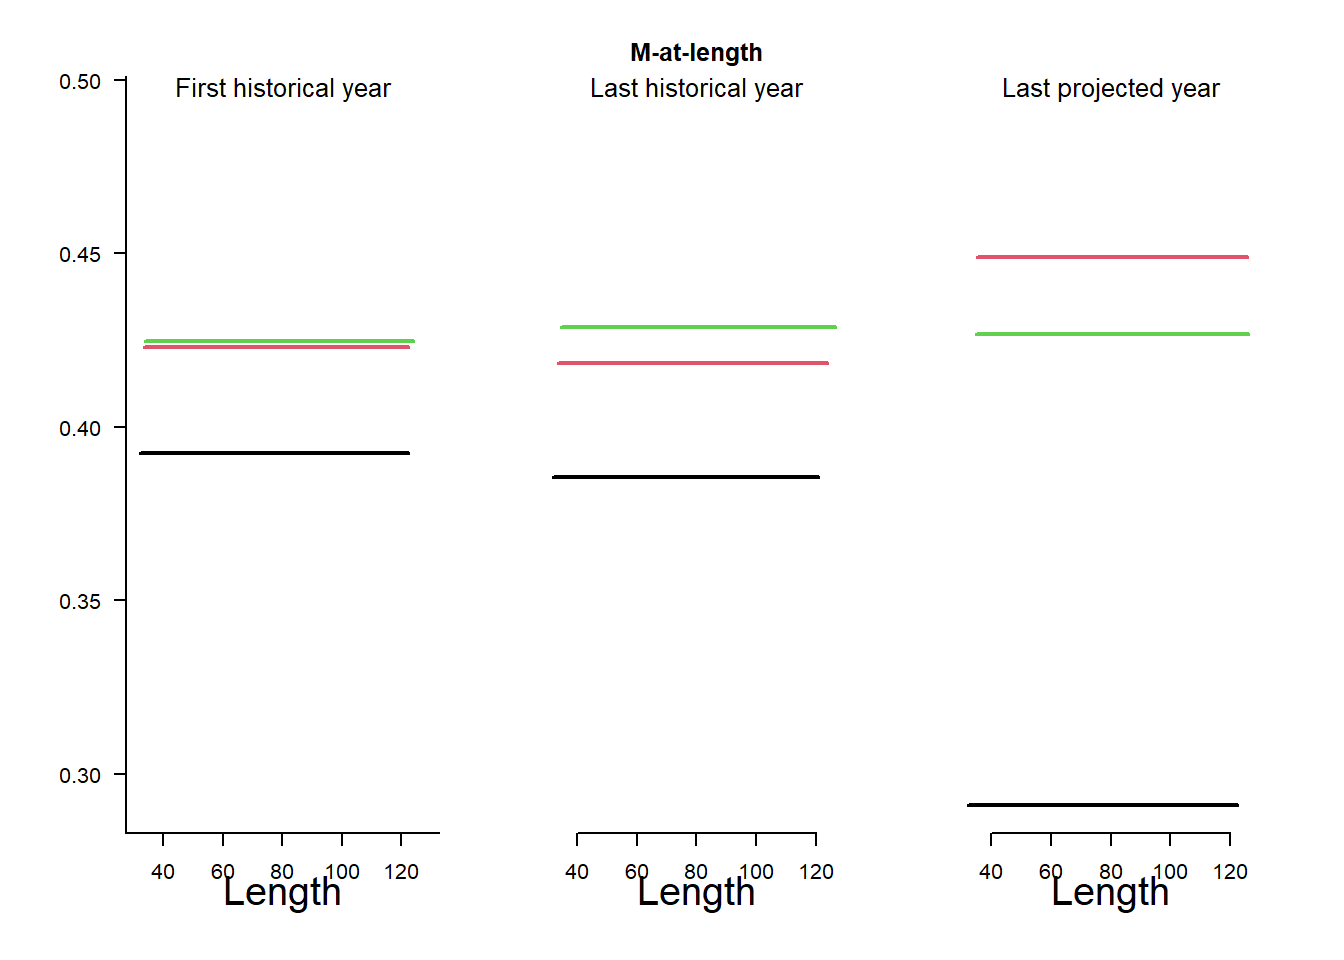
plot('M', Albacore)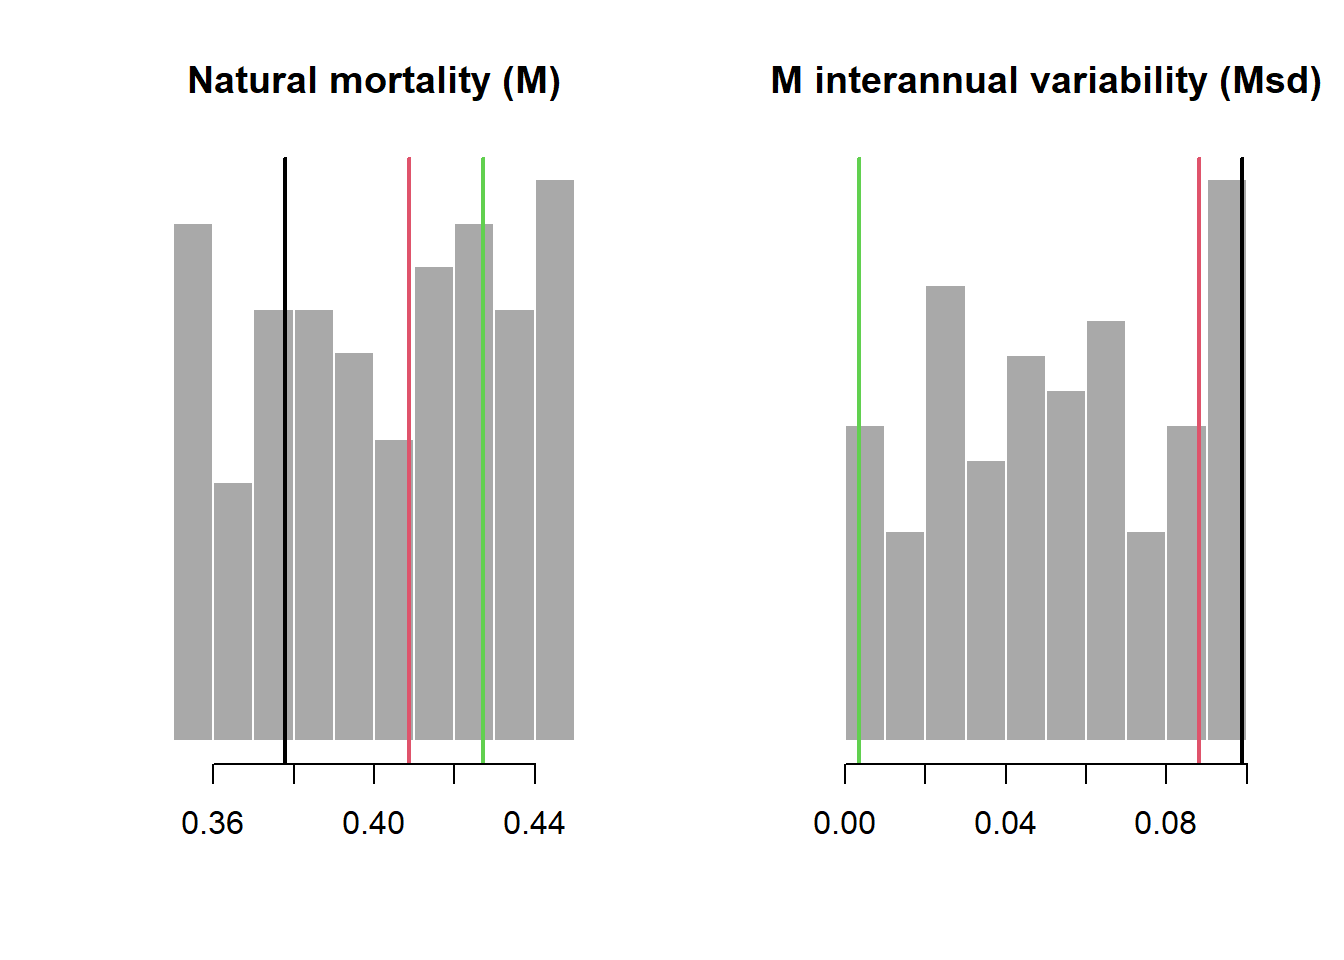
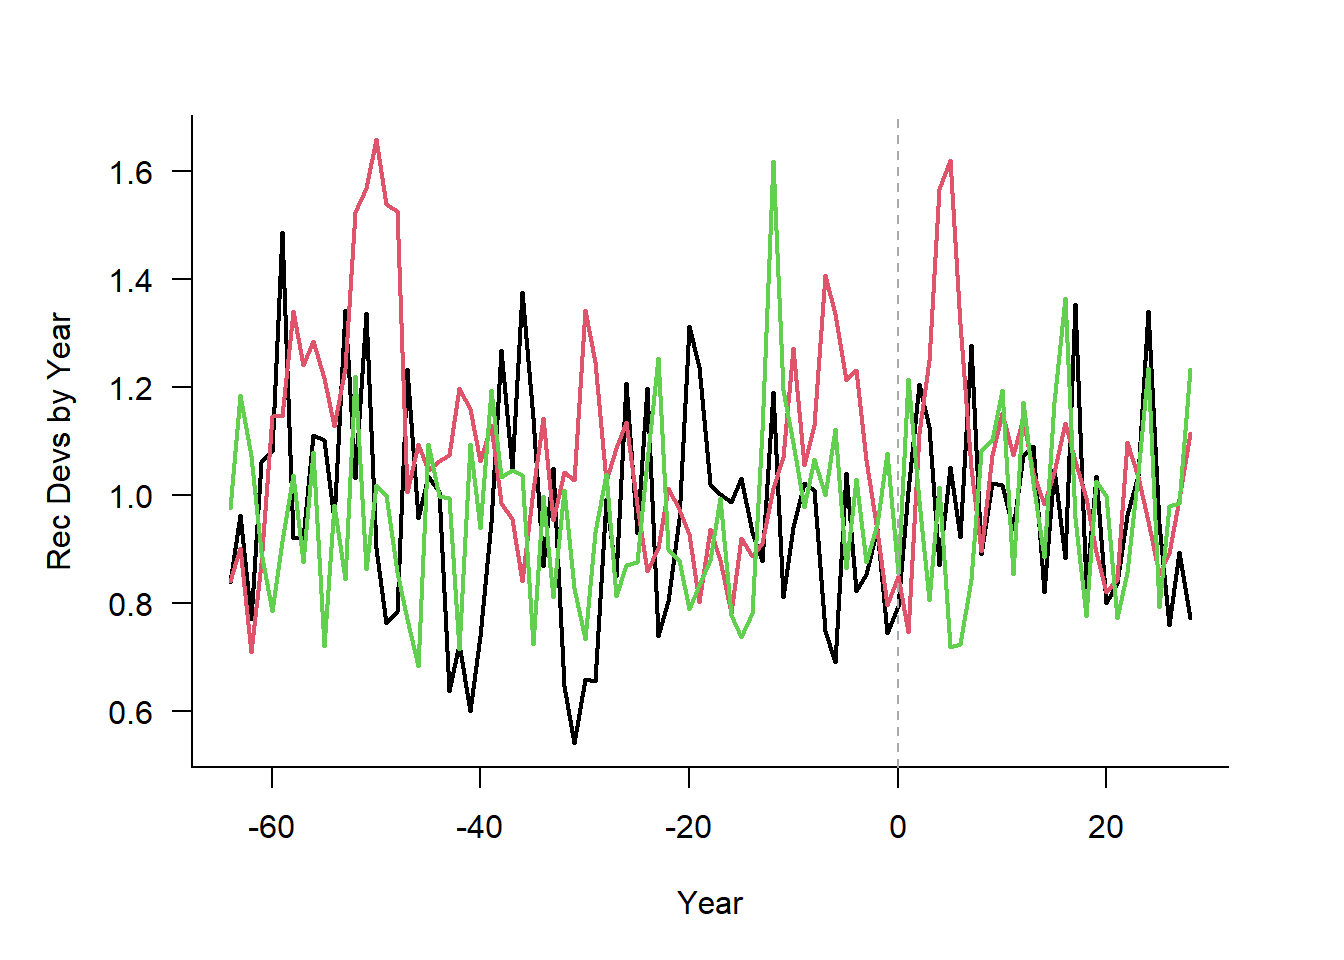
plot('Recruitment', Albacore)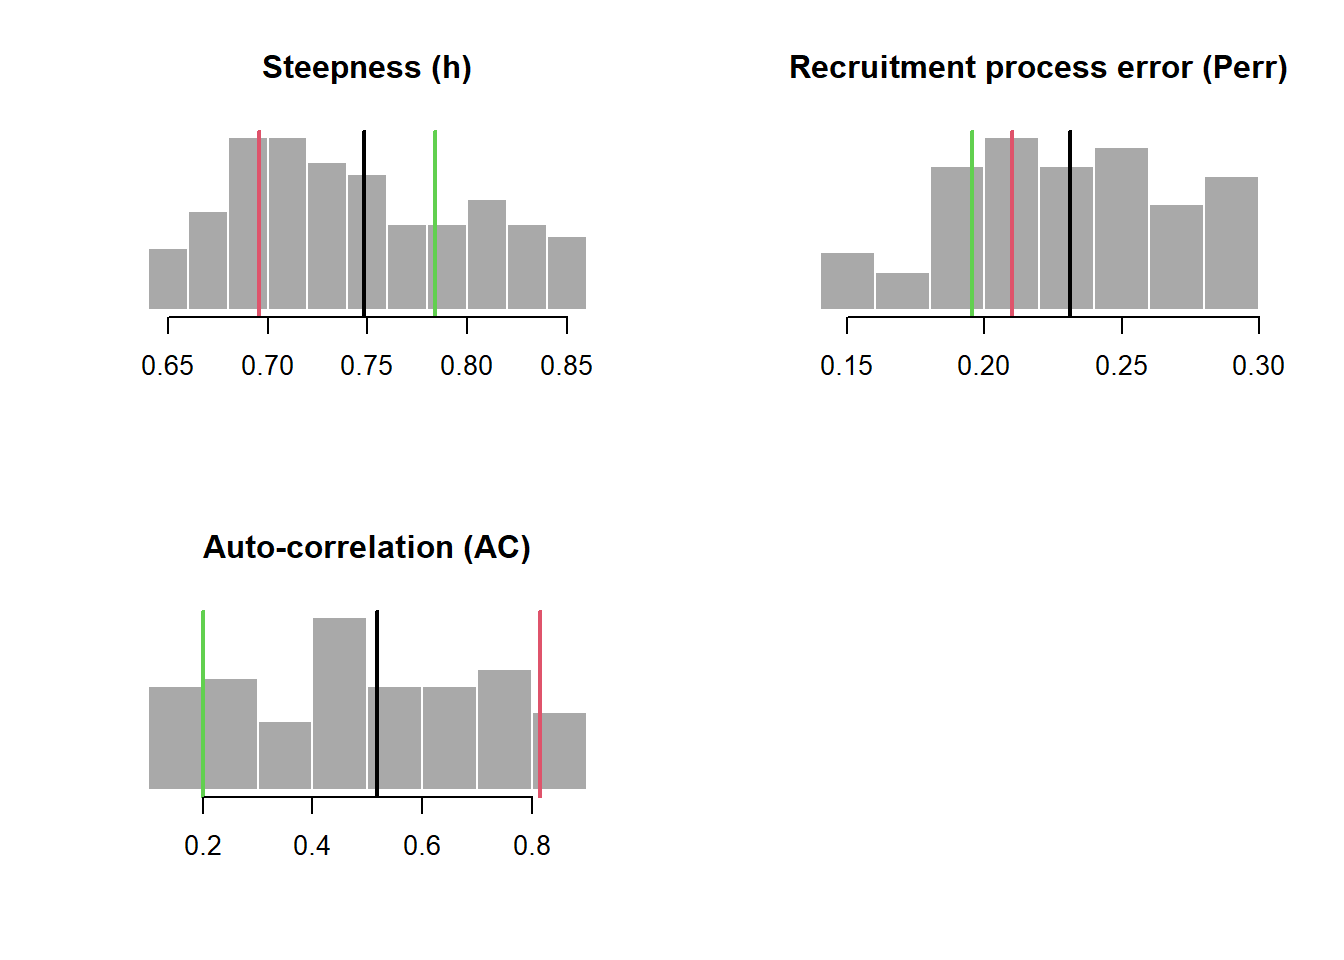
plot('Spatial', Albacore)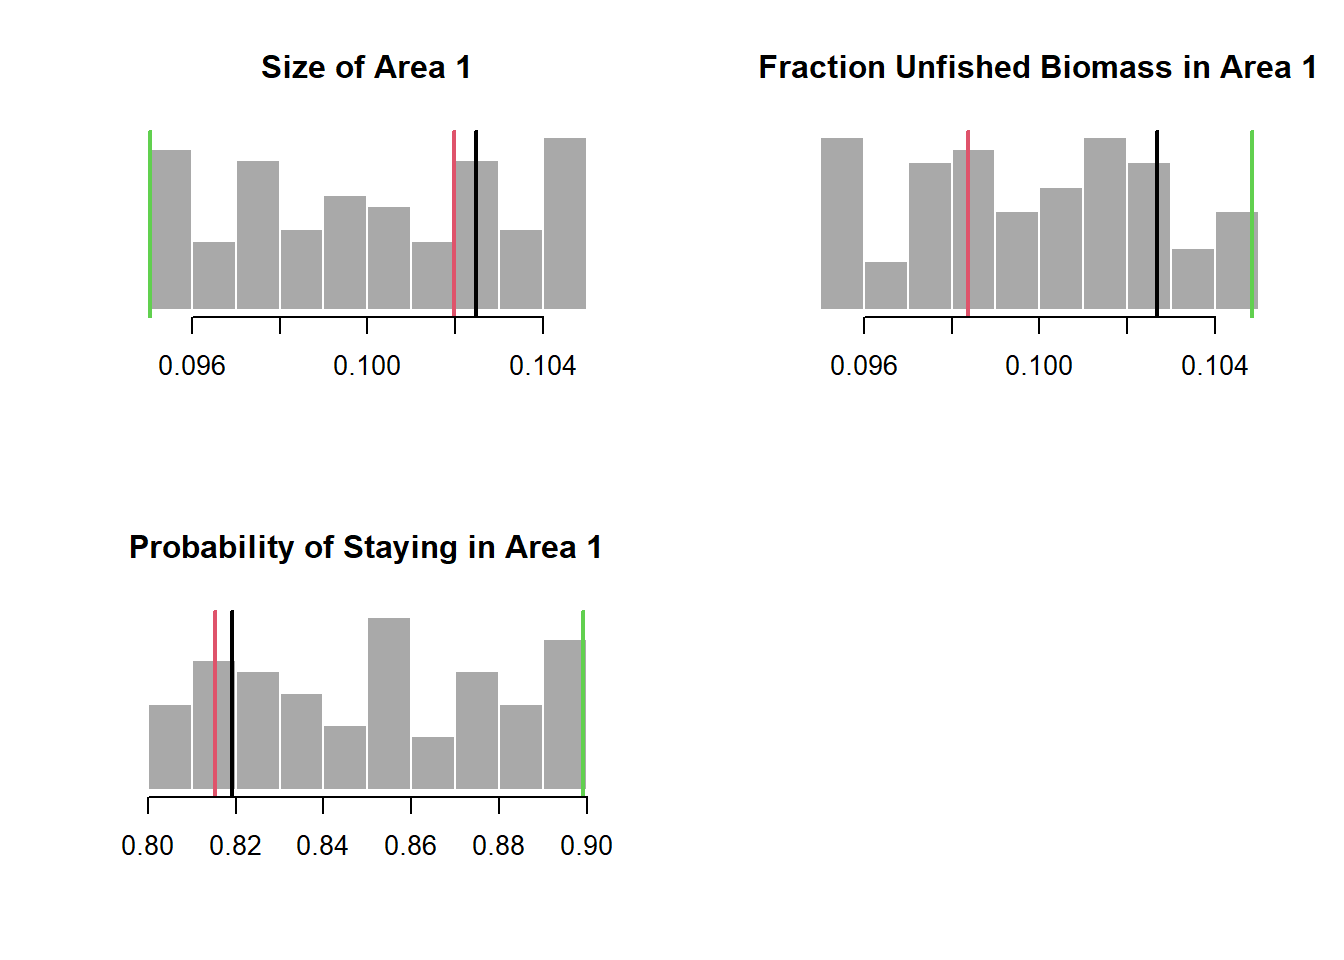
Unlike plot(Stock) which generates a HTML report that opens in the web browser, plot('character', Stock) will create the plots in the R console.
See the help documentation or type ?plot.Stock in the R console for more information on plotting Stock object.